Case study / Agribusiness / Web app

PTPN IV Gunung Bayu

A web app for the Gunung Bayu palm oil mill. Fresh fruit bunches coming in from the estate and from third parties, lab results for crude palm oil, quality norms and the daily report all live in one system.

Web appMill operationsLab data
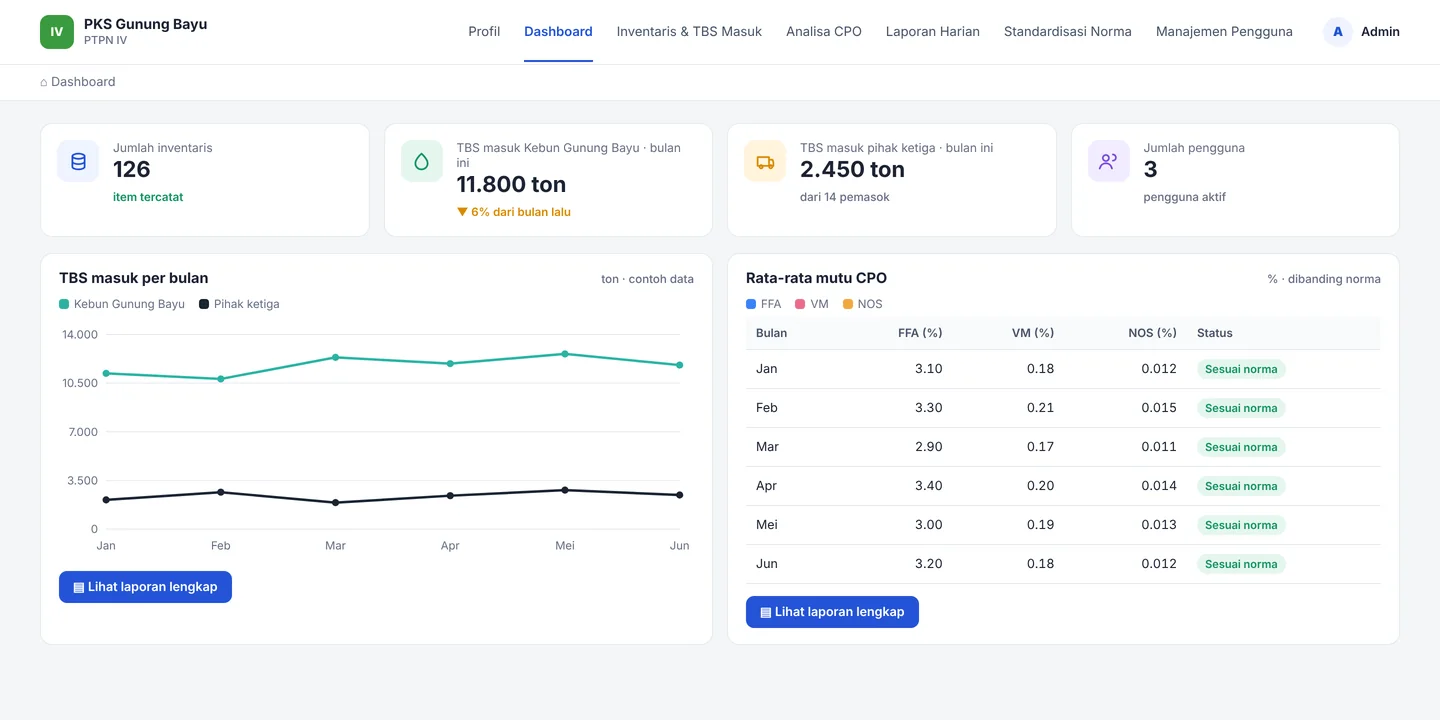
Gunung Bayu mill dashboard with inventory count, fresh fruit bunches received from the estate and from third parties, a monthly intake chart and average CPO quality

Client

PTPN IV · PKS Gunung Bayu

Industry

Palm oil · agribusiness

Location

Bosar Maligas, Simalungun

Services

UI/UX design, Web development

Platform

Web

01 / The problem

Where it started

A hundred-year-old mill, tracked in one place.

The Gunung Bayu palm oil mill belongs to PTPN IV Regional II and sits in Bosar Maligas, Simalungun. It has been running since 10 February 1924, processing fruit from the Gunung Bayu estate and from outside suppliers into crude palm oil.

Every day the mill weighs truckloads of fresh fruit bunches (TBS), and its lab tests the oil each shift. The mill wanted those numbers recorded in one system, checked against its quality norms, and turned into a daily report without retyping.

What success had to look like

From the weighbridge to the daily report.

  • 01

    TBS intake recorded per truck, split between the estate and third parties.

  • 02

    CPO lab results entered per shift: FFA, VM and NOS.

  • 03

    Quality norms set once and used to judge every result.

  • 04

    A daily report and an inventory list, ready for management.

02 / The process

From the mill floor to the dashboard.

Four steps, from following the fruit to handing over the system.

Phase 01

Follow the fruit

From the weighbridge through the lab to the daily report.

Phase 02

Set the norms

Quality limits for each parameter, kept in one settings page.

Phase 03

Build the modules

Intake, inventory, CPO analysis, daily report and user management.

Phase 04

Hand over

Accounts for the mill team and the dashboard as the starting page.

03 / What we built

Six modules around one mill.

From the dashboard to inventory and user access.

01 / Dashboard

Fruit in, oil quality out.

Monthly intake from the estate and from third parties side by side, with average oil quality underneath and the inventory count on top.

  • Estate and third-party fruit as separate lines
  • Average FFA, VM and NOS per month
Mill dashboard with intake chart and oil quality table

02 / TBS intake

Every truck, weighed once.

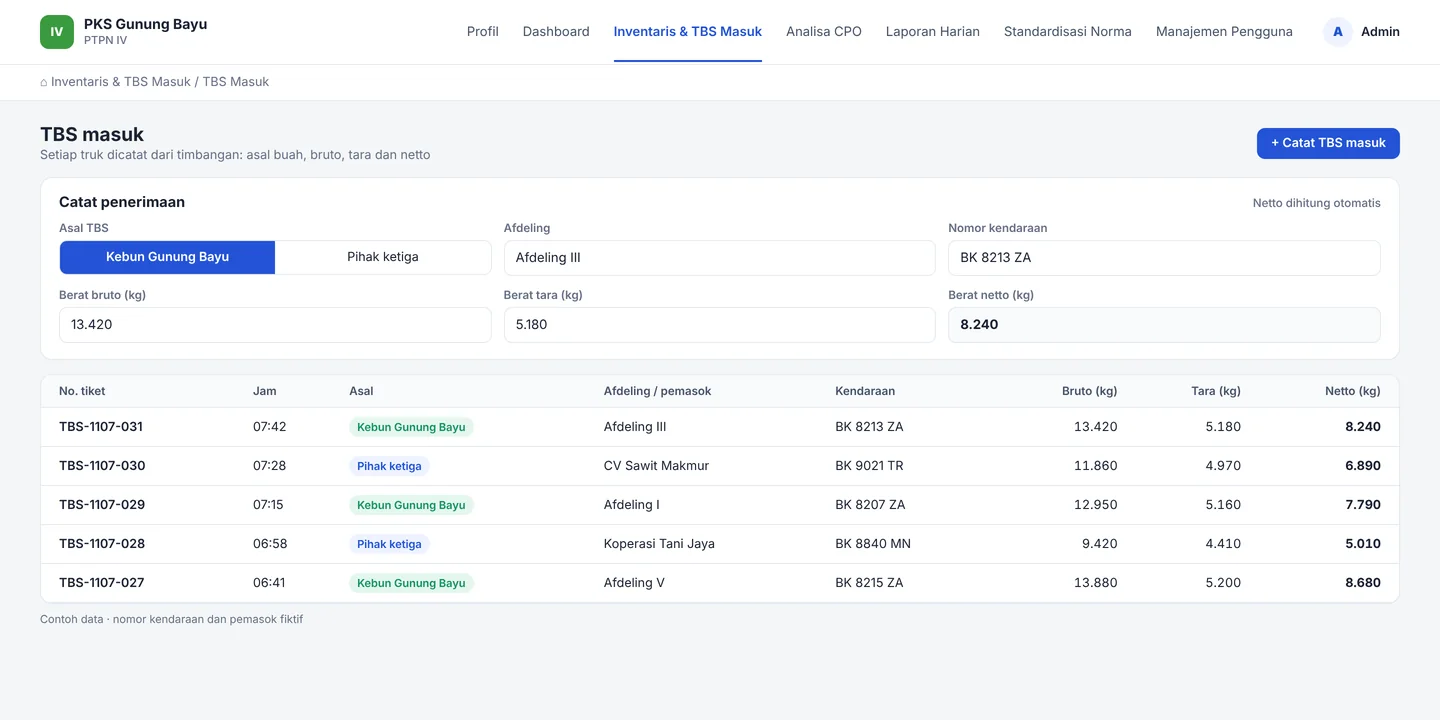
The officer picks the source, estate division or supplier, and enters gross and tare weight. Net weight is calculated, and the ticket joins the day's list.

  • Estate divisions and third-party suppliers
  • Net weight calculated on entry
TBS intake form and list of trucks with gross, tare and net weight

03 / CPO analysis

Each result against its norm.

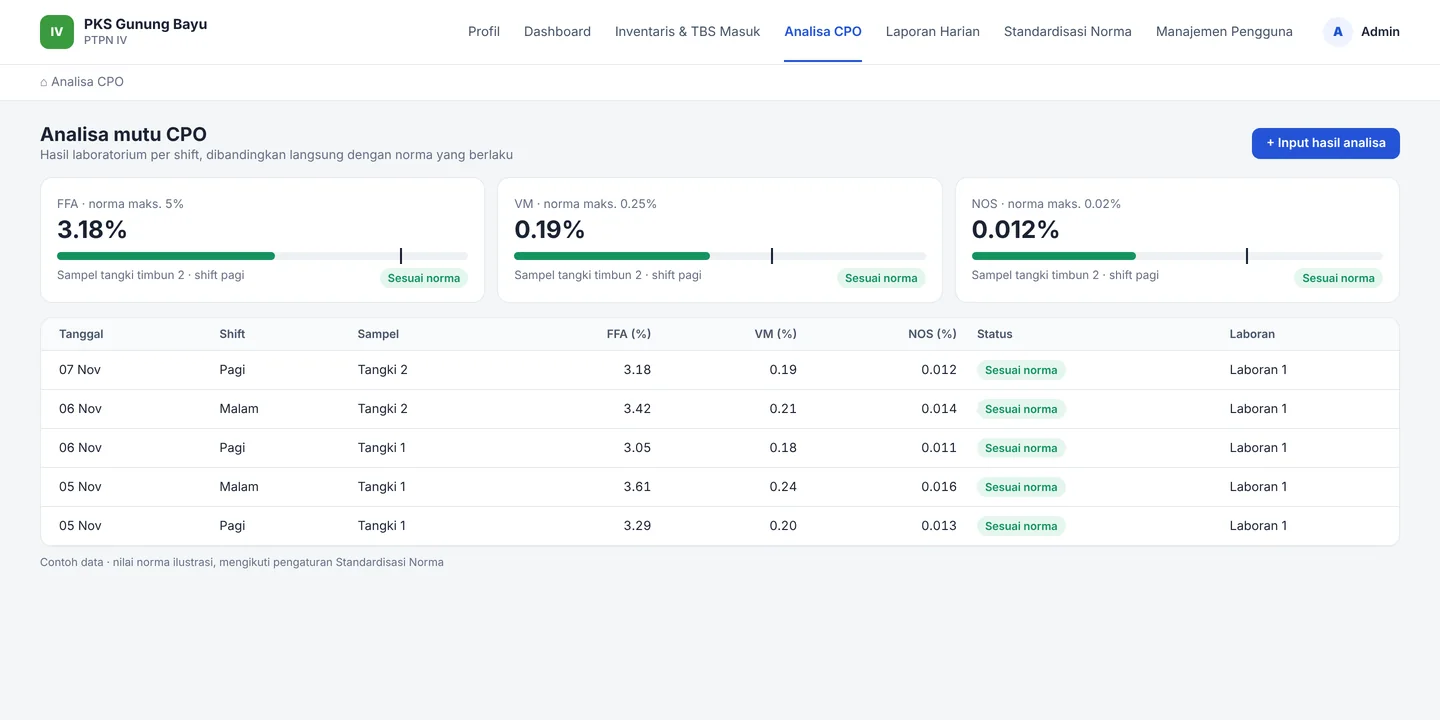
Lab results go in per shift and sample tank. Each parameter is shown against the limit set in Standardisasi Norma, so a result above the norm stands out the moment it is entered.

  • FFA, VM and NOS per sample
  • Pass or fail against the current norm
CPO analysis page with FFA, VM and NOS against their norms and a table of results per shift

04 / Daily report

The day, already added up.

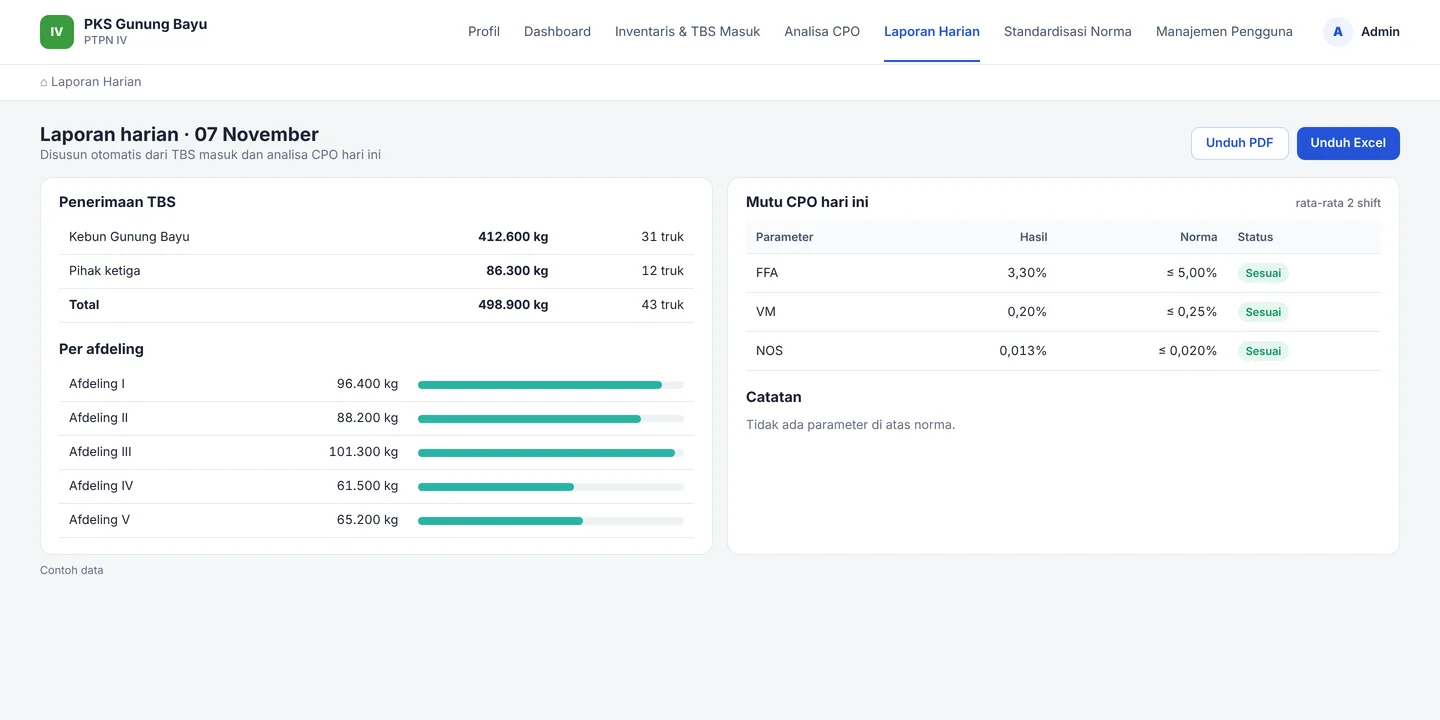
Intake by source and by division, and the day's oil quality against its norms, compiled from what the officers and the lab entered. Download as PDF or Excel.

  • Totals per source and per division
  • Quality summary with the norm beside it
Daily report with TBS intake by source and division and CPO quality against norms

05 / Standardisasi Norma

Limits set in one place.

The quality limits for each parameter are kept on one settings page. Change a norm there and the analysis page and daily report use the new value.

  • FFA: batas maksimum (%)
  • VM: batas maksimum (%)
  • NOS: batas maksimum (%)

06 / Inventory & users

Assets and access, managed.

An inventory list of the mill's items sits next to TBS intake, and user management controls who can enter intake, lab results or only read the reports.

  • Inventaris item pabrik
  • Kelola akun dan akses

Screens recreated for this case study with sample data. Norm values shown are illustrations.

04 / Results

One system from weighbridge to report.

Intake, quality, reporting and access, in one system.

Intake

Estate and supplier fruit, apart.

NowThe mill sees how much fruit came from its own estate and how much from third parties, per day and per month.

Quality

Off-norm results show at once.

NowEvery lab result is checked against the current norm the moment it is entered.

Reporting

The daily report builds itself.

NowIntake and quality totals come straight from the day's entries, ready as PDF or Excel.

Access

Each role, its own pages.

NowUser management decides who records intake, who enters lab results and who only reads.

Next project / Public information website

Inspektorat Sumut

A rebuilt website for the North Sumatra Inspectorate, with PPID documents, legal references and reporting channels one click from the homepage.

Open project
Homepage of the Inspektorat Provinsi Sumatera Utara website: banner slider, latest news and a Layanan Cepat panel for reporting gratification, whistleblowing, satisfaction surveys and information requests

Your buildcould benext.

Start

Reply within one business day